Data Chart Platform
Company Project
Individual Contributor
Data Visualization
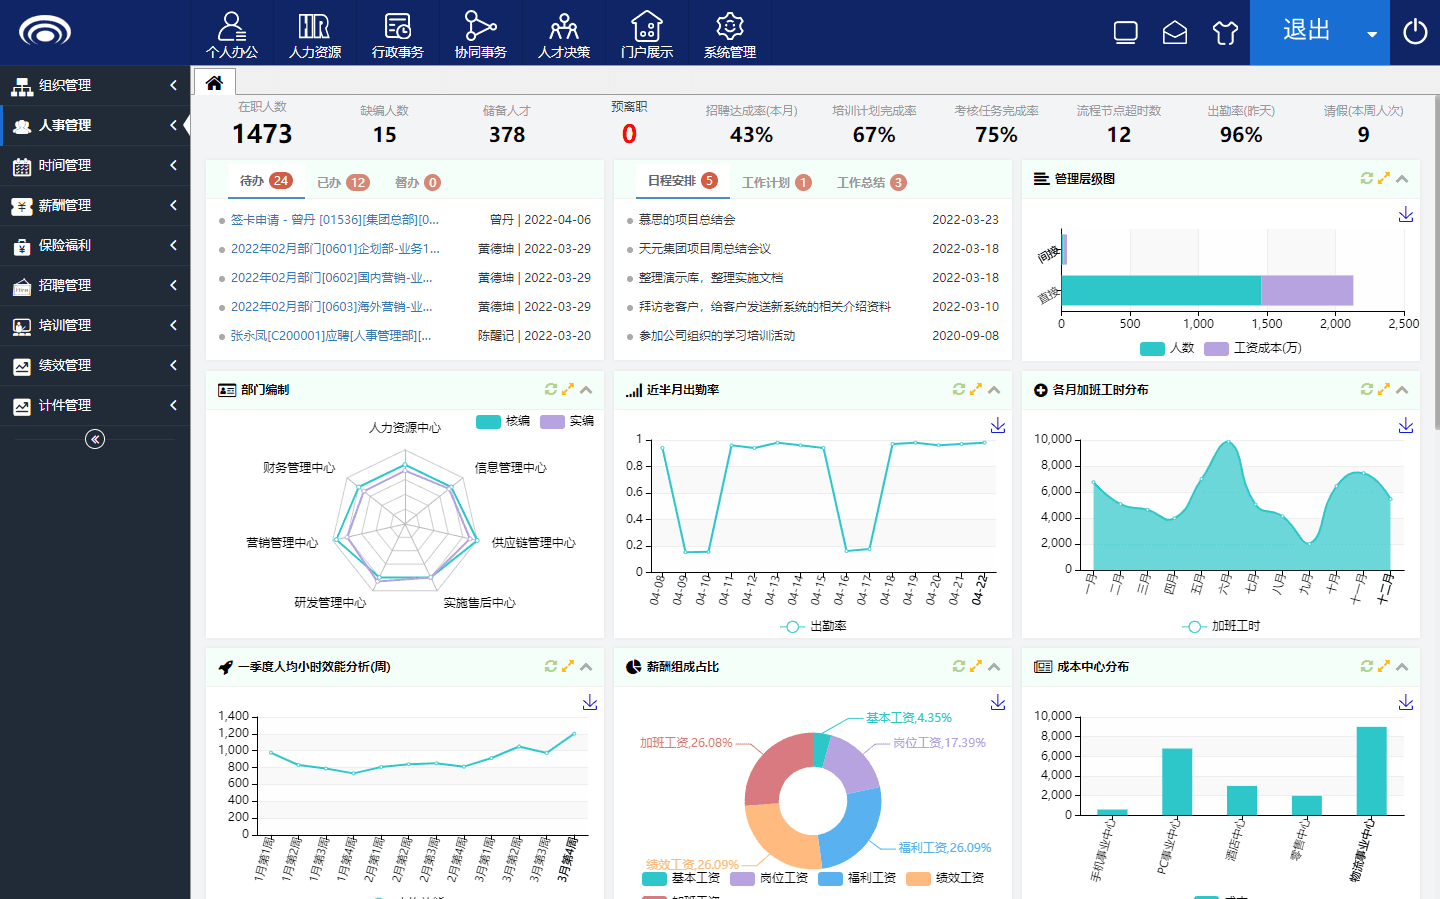
The Data Chart Platform project focused on building an interactive platform for data visualization and real-time reporting. The goal was to enable users to analyze complex datasets through customizable charts and visualizations, empowering businesses to make data-driven decisions quickly and effectively.The Data Chart Platform project focused on building an interactive platform for data visualization and real-time reporting.
Key Features
Customizable Charts
• Users can create and customize various types of charts, including bar, line, and pie charts, to visualize data effectively.
Real-Time Reporting
• The platform provides real-time data updates, allowing users to track changes and trends as they happen.
Data Integration
• The platform supports integration with multiple data sources, enabling seamless data import and analysis.
User-Friendly Interface
• Designed with a focus on usability, the platform offers an intuitive interface for both novice and advanced users to interact with the data.
Technology Stack
| Layer | Technologies |
|---|---|
| Frontend | react:^16.13.1, typeScript:^4.3.5 |
| Backend | Java, MySQL |
| Deployment | webpack:4.46.0 |
Challenges
 Data Handling
Managing large datasets and ensuring real-time updates without performance degradation posed a significant challenge.
Cross-Platform Compatibility Ensuring the platform worked smoothly across different browsers and devices required extensive testing and optimization.
User Personalization Allowing users to fully customize their charts while maintaining ease of use and consistency was a complex task.
Achievements
The Data Chart Platform delivered a robust, scalable solution for real-time data visualization, enabling users to create and customize charts effortlessly. It integrated seamlessly with various data sources, providing flexible analytics capabilities. The user interface was highly intuitive, making it accessible to a wide range of users. The platform also handled large datasets efficiently, ensuring smooth performance even with real-time updates.
TABLE OF CONTENTS
- Overview
- Key Features
- Customizable Charts
- Real-Time Reporting
- Data Integration
- User-Friendly Interface
- Technology Stack
- Frontend
- Backend
- Deployment
- Challenges
- Data Handling
- Cross-Platform Compatibility
- User Personalization
- Achievements
